When maintaining a website, online store or a blog, users have an expectation of being able to view your service 24/7. Having high uptime is critical for user satisfaction and this is baseline expectation for any web-based operation. Therefore, in order to deliver a high-quality service, having awareness of when the site goes down is critical. In this article we will teach you how to do just that.
Motivation
If your service provider is unable to guarantee or deliver on the promise of high availability, it is time to move your operations to another service provider that can. The only way you can know this though, is by utilizing an uptime monitoring service.
At Mobile First we build and maintain several different websites, servers, and network-connected devices. Being able to verify that each and every service is up and running is valuable. Even more so, we want to be notified whenever a service goes down to be able to address the issue. For this purpose we use Uptime Robot.
Without trying to sound like shameful an ad, we recommend this service because we have been using it ourselves for over a year, it has been absolutely wonderful, and they give you a lot of the necessary features for free.
Essential Free Features
| ☆ Setup up to 50 different monitors |
| ☆ Each monitors can run at up to 5 minutes intervals |
| ☆ You can setup HTTP, ping, or port monitor |
| ☆ monitor for presence/absence of a keyword in the response |
| ☆ Setup email alerts whenever a service goes down |
| ☆ Display a custom dashboard within your own domain |
| ☆ And display your dashboard on a TV screen |
| ☆ Customize your dashboard with your own logo |
| ☆ Public dashboard can be password protected |
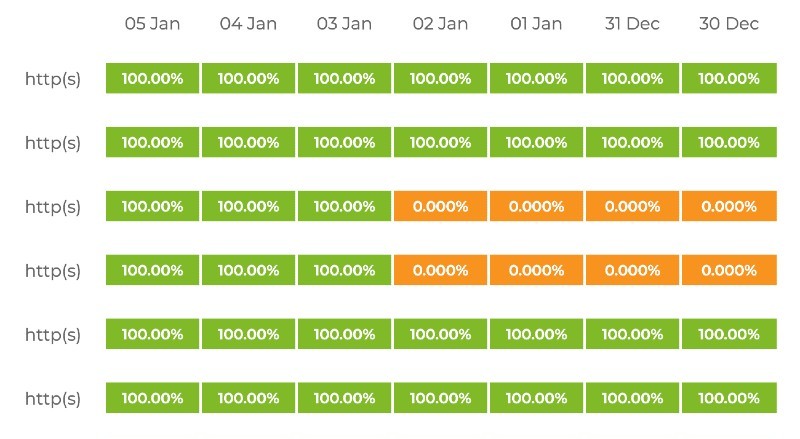
In case you need more monitors, or you need monitors to run more frequently, they also offer a paid plans. But give free option a try and see how it works for your needs. If you want to see an example of a live dashboard, you can check our dashboard here.
Setting up & Using the Uptime Robot Service
1. Sign up Before you can setup monitors you have to [sign up](Their signup process. Their signup process is really simple: fill out 3 fields then verify your email address.
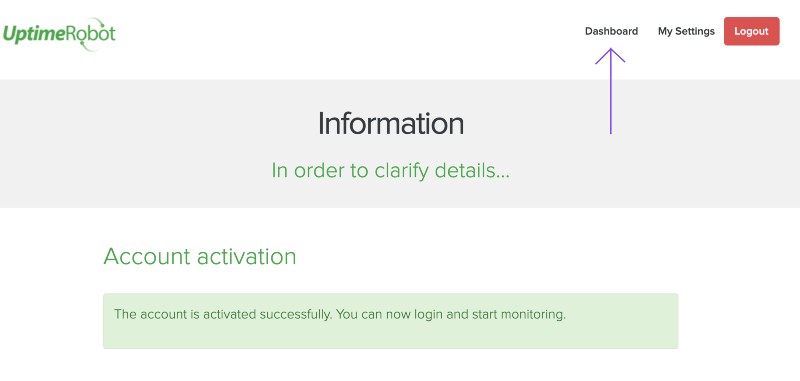
2. Verify email Check your inbox, look for an email from Uptime Robot that says “account activation” and click the link. You will then see a page like the one shown below.

3. Go to dashboard You will find the link in the top corner of the page.
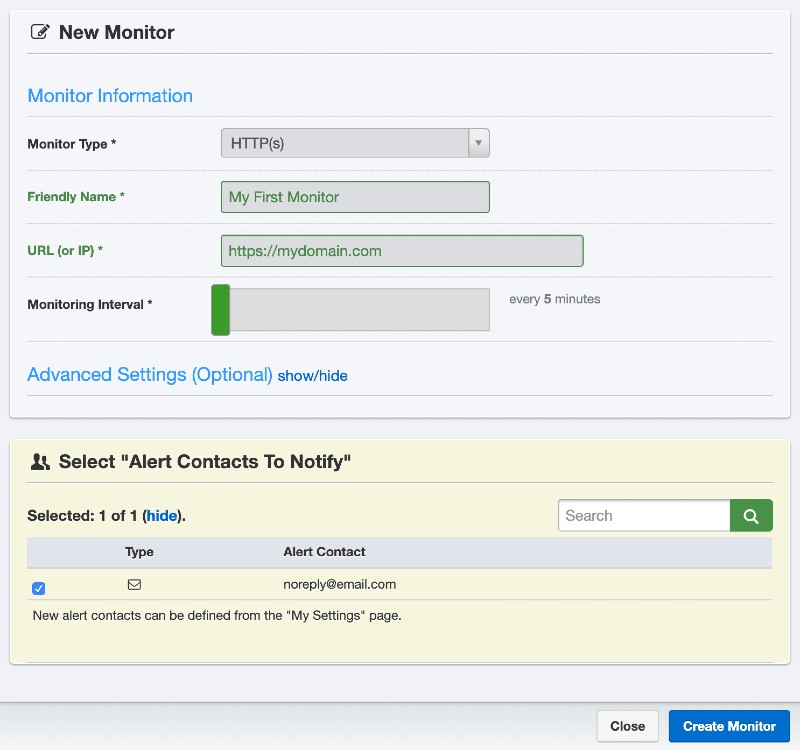
4. Add new monitor When you get to the dashboard, it will initially be empty. Look for a button that says “add new monitor”. In the image blwo we show how to setup a basic HTTP monitor. If you want to be notified every time there is an issue with the website availability, select and email address in the second input box.
5. Save your monitor When you have finished the configuration, click “Create Monitor”. Then add more monitors or close the window. Your dashboard will now list the monitors you have created.

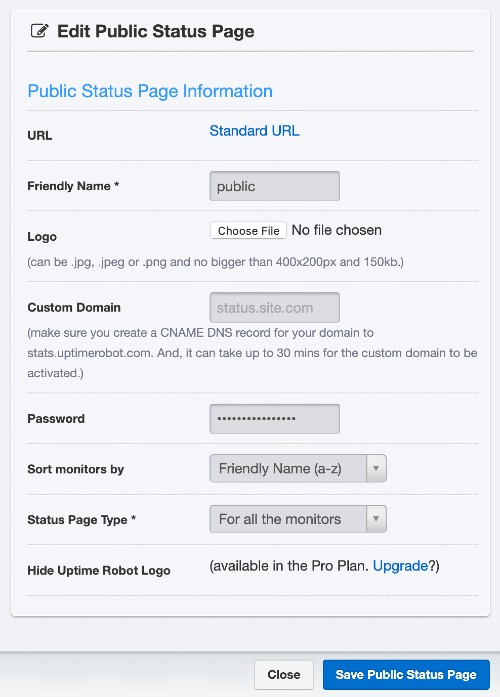
6. Create a public status page (optional) If you would like that uptime statistics to be viewable to everyone, go to my settings, scroll to Public Status Pages and click Add Public Status Page. You can then select either specific monitors only, or all your monitors; customize your page logo, and configure your custom domain. If you want, you can password protect the page.
Below is a basic setup example for a password protected, public status page.

That is it! We hope you enjoyed this tutorial and created some monitors.
Happy Monitoring!